Release of Version 2027.1 for FastReport Online Designer
The new FastReport Online Designer version (2027.1) focuses on designer extensibility, optimization and UI improvements. Among the key changes are support for custom report components that are plugged into the designer via the builder, performance optimization of the "Map" components for the .NET and VCL cores, and build history in FastReport Online Designer Builder.
In addition, this version includes the following improvements: the "Hierarchy" block in the DataBand properties, the "Size scale" section for the "Map" object, and new options for hiding UI elements: the "Open" button, the "Report" tab buttons, the "Events" tab, the FRX editor and the "Report tree", "Data" and "Properties" panels. Several bugs related to loading and saving reports, object restrictions (Restrictions), data sources, and component rendering have also been fixed.
New Features
Custom components (Plugin SDK)
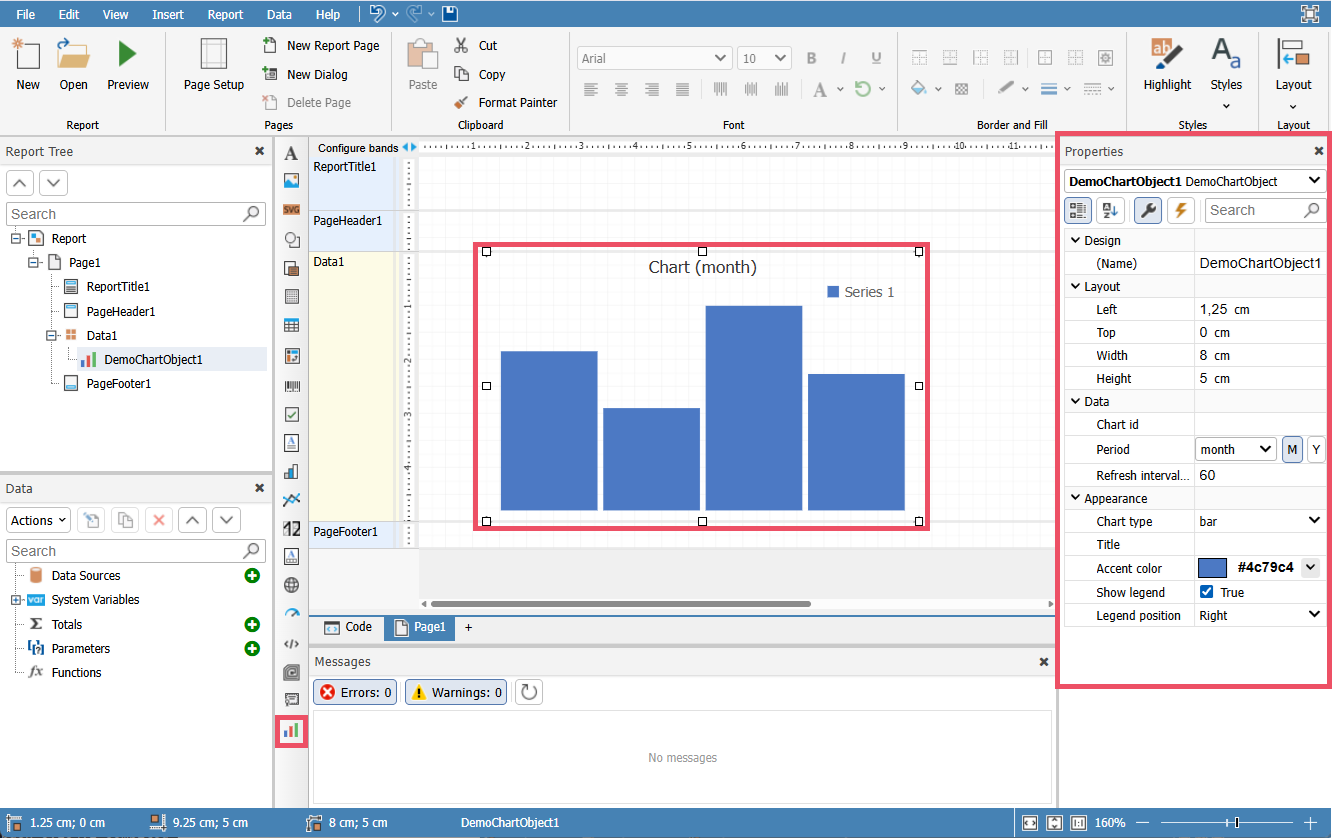
Version 2027.1 makes it possible to add your own report components to Online Designer. For example, you can create your own chart object with a choice of chart type and period taken from your application's data.
Components are developed with the Plugin SDK, a public designer API that allows you to:
- register a component in the components palette (with its own icon, caption and group);
- implement rendering of the component on the report page;
- describe the list of component properties for the "Properties" panel with standard value editors;
- add a custom component settings dialog (opened by double-click or from the context menu);
- configure saving and loading of the component in the .frx format;
- inherit a component from an existing one (for example, from `TextObject`) and override only the behavior you need.
A finished plugin is uploaded to FastReport Online Designer Builder (via the builder interface or the Builder API) and is compiled into a single designer bundle during the build. Plugin files are stored in the builder user's personal storage and can be included in or excluded from each build.
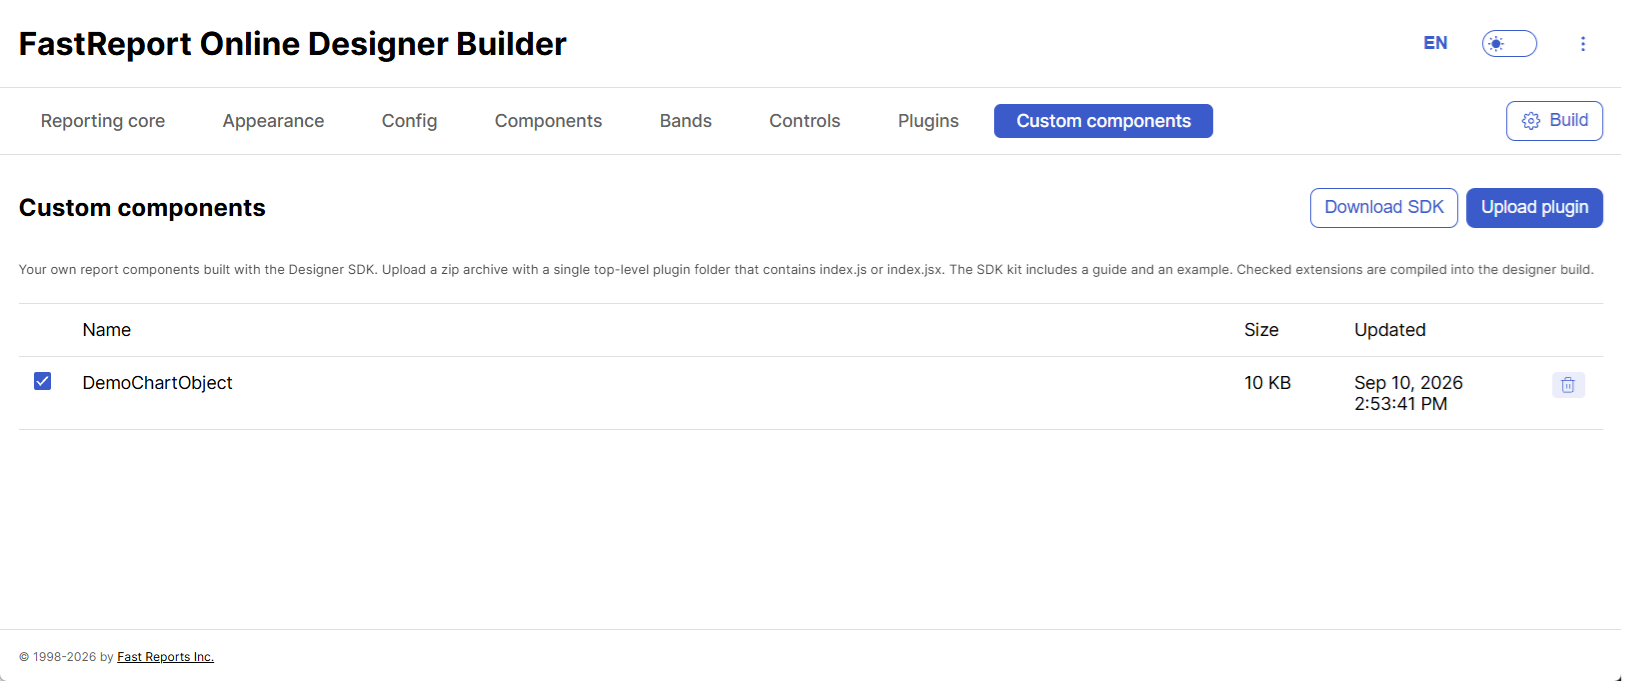
Report preparation and server-side preview use a companion .NET plugin that registers the object in FastReport .NET. The component type name in the designer must match the name of the component's .NET class.
Build history in FastReport Online Designer Builder
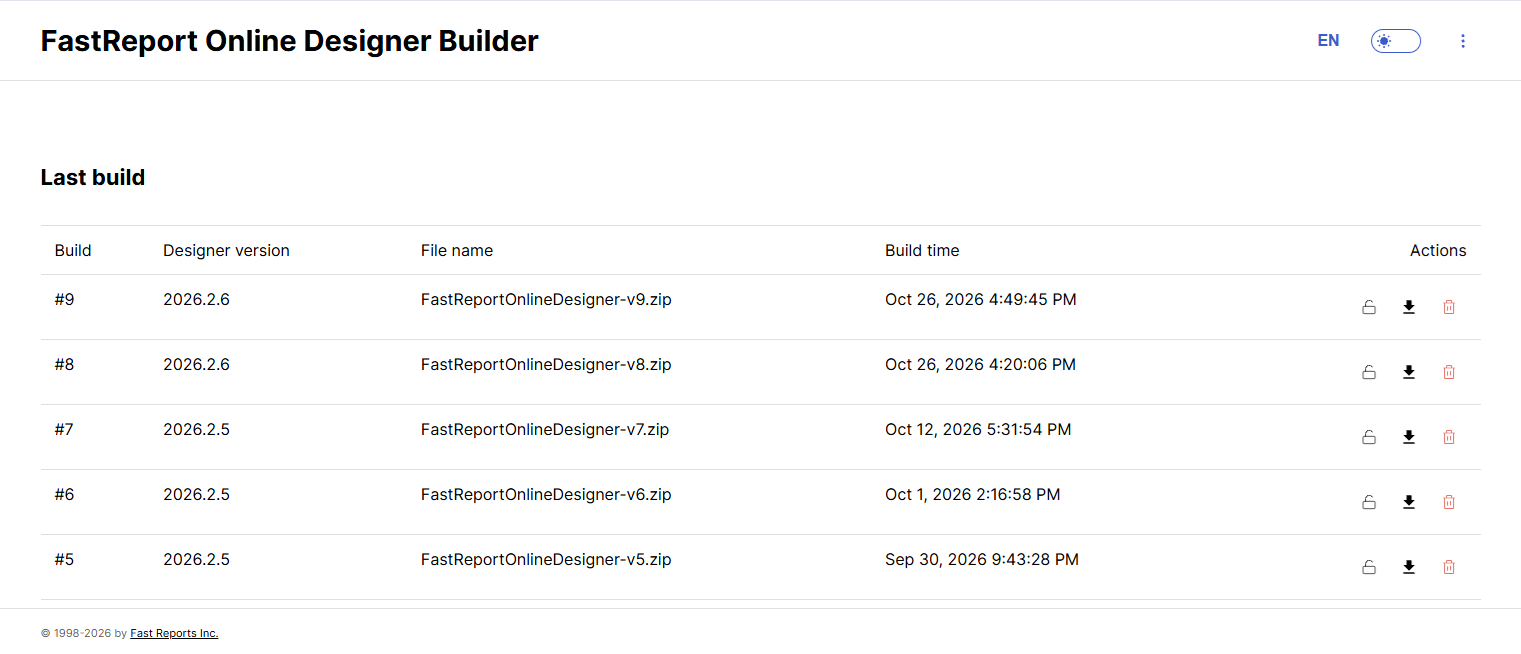
Build history has been added to the designer builder: the 5 most recent builds are now displayed. A "Remember build on server" checkbox has also been added, allowing you to keep a build for reuse.
"Hierarchy" block in DataBand properties
The "Hierarchy" block has been added to the data band (DataBand) properties, just like in the FastReport .NET desktop designer. It lets you configure hierarchical (tree-like) reports in Online Designer.
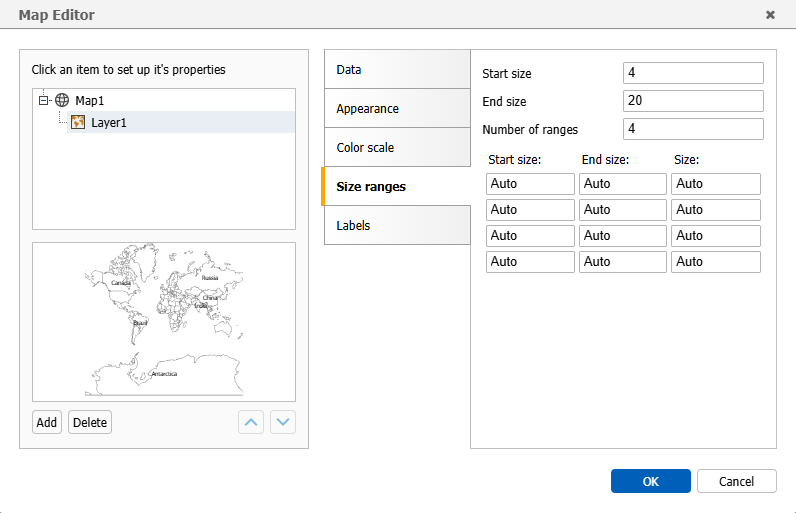
"Size scale" section for the "Map" object
The "Size scale" section has been added for the "Map" object (MapObject). It lets you edit the start and end size, as well as the scale ranges, just like in the desktop designer.
Improvements
Extended UI customization options
New options for restricting the functionality available to the user have been added for developers who embed Online Designer in their applications:
- Hiding the "Open" button: the open report button can be hidden via designer settings passed from the backend (
DesignerConfig); - Hiding "Report" tab buttons: individual buttons of the "Report" tab of the main toolbar can now be hidden;
- Disabling the "Events" tab and the FRX editor: the "Events" tab in the properties panel and the FRX editor page can be disabled completely.
- Disabling the "Report tree", "Data" and "Properties" panels: these panels can now be hidden via the "View" tab, just like in the desktop designer.
Asynchronous table creation in data sources
Support for asynchronous table creation in data sources has been added.
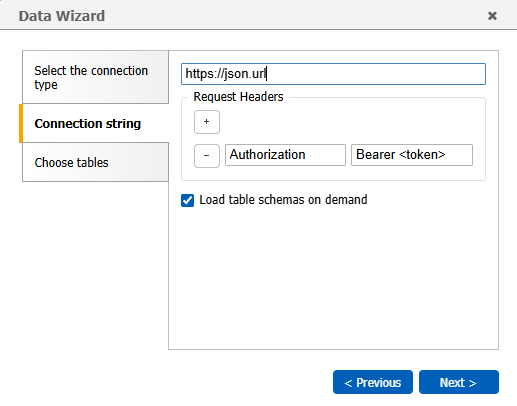
Improved JSON connection
The JSON data source connection now features a redesigned interface that makes setup easier, following the familiar design of the FastReport .NET desktop report designer.
Optimized rendering of the "Map" object
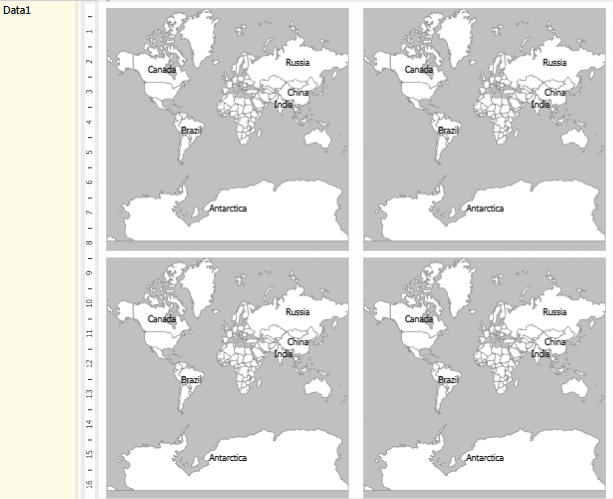
The rendering of the "Map" object (MapObject) has been reworked from SVG to Canvas. This speeds up map display and makes the designer more responsive when working with reports that contain maps.
Bug Fixes
Object restrictions (Restrictions) are now respected
Fixed an issue where object restrictions configured in the desktop designer, such as DontModify and HideAllProperties, were ignored in Online Designer. All object properties were displayed, including the restrictions themselves, allowing users to remove the restrictions and edit the object. Online Designer now correctly respects the restrictions saved in the report.
Fixed data loss when loading and saving reports
Several issues have been fixed that caused a report loaded into Online Designer to differ from the original:
- Expression truncation: fixed an issue where an expression was truncated when the report was saved;
- Band order: fixed an issue where the PageHeader and ReportTitle bands swapped places when the report was loaded, breaking the layout;
- Object placement: fixed a difference in object placement between Online Designer and the desktop designer;
- Dialog form controls: fixed an issue where most of the controls on a dialog form were lost when the report was loaded and removed from it when the report was saved.
Fixed barcode rendering
Fixed an issue where the designer supported only 21 barcode types. When a report containing unsupported barcode types was opened, the objects were not displayed on the page, and the list in the "Objects" panel remained empty.
Fixed selection of nested tables as a data source
Fixed an issue where nested tables (for example, from JSON with a hierarchical data structure) were not displayed in the data source selection control and could not be selected as a data source for a band.
Fixed the reportEdited flag
Fixed an issue where the reportEdited flag was not updated for some report changes. The application that embeds the designer now correctly receives notifications about all report changes.
Full list of changes
New functionality
+ Support for custom components (Plugin SDK)
+ Build versioning in FastReport Online Designer Builder
+ Build history in FastReport Online Designer Builder
Improvements for .NET solutions:
+ Added the "Hierarchy" block to the DataBand properties;
+ Added the "Size scale" section for the "Map" object;
+ Added the ability to hide the "Open" button;
+ Added the ability to hide the "Report" tab buttons;
+ Added the ability to disable the "Events" tab and the FRX editor;
+ Added the ability to disable the "Report tree", "Data" and "Properties" panels;
+ Added support for asynchronous table creation in data sources;
+ Improved the JSON connection, modeled after the desktop designer;
+ Reworked the rendering of the "Map" object from SVG to Canvas;
Improvements for VCL solutions:
+ Added a description for the chart component (Chart);
+ Added translations to the "Fill" dialog;
Bug fixes:
- Fixed an issue where object restrictions (Restrictions) were ignored;
- Fixed expression truncation when saving a report;
- Fixed an issue where the PageHeader and ReportTitle bands ignored the TitleBeforeHeader flag when the report was loaded;
- Fixed a difference in object placement when loading a report in Online Designer;
- Fixed the loss of dialog form controls when loading a report;
- Fixed an issue where the size of the bottom info panel changed when an object contained long text;
- Fixed an issue where the designer supported only 21 barcode types;
- Fixed an issue where nested tables were not displayed in the data source selection control;
- Fixed an issue where the table name was not filled in automatically in the DataBand when a field was dropped onto the workspace;
- Fixed an issue where the reportEdited flag was not updated for some changes;
- Fixed an error when preparing a report with an AdvMatrix object;
- Fixed an issue where element properties stopped being displayed for a MatrixObject on a large number of pages;
- Fixed an issue where the "Copy page" function did not work;
- Fixed an issue where picture hyperlinks did not work;
- Fixed the display of an uploaded SVG on the workspace;
- Fixed Rich Text rendering (font and letter spacing);
- Fixed an issue where the font color was not applied in conditional highlighting (Highlight);
- Fixed image scaling in the "PictureControl" control on a dialog form to match the desktop designer;
- Fixed page-by-page display in preview mode;
- Fixed applying styles set in the builder to the Avalonia theme;
- Fixed errors when using the designer in Blazor applications (cutting and pasting objects, saving reports with MSChart charts);
- Fixed an issue where the axis interval in MSChart was ignored;
- Fixed the display of object icons in the classic theme;
- Added the missing Bookmark property;
- Added the missing Tag property for SubReport;
- Added the missing CoalesceWords property for the reworked HtmlObject.